Project Overview
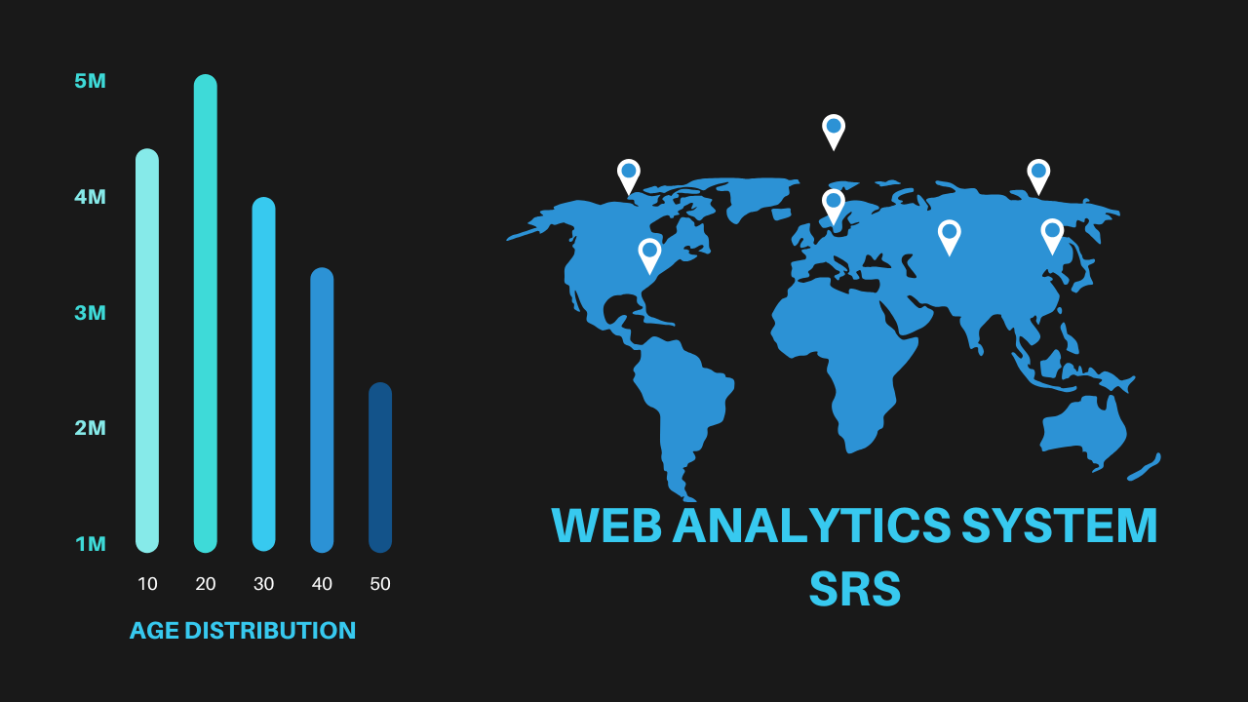
Picture a Web Analytics System that acts like a detective for your website, uncovering clues about visitor behavior to help you make smarter moves. This project aims to build a tool that tracks real-time visitors, traffic sources, and user interactions, giving you a clear picture of what’s happening on your site.
You’ll see where people are coming from, which pages they love, and where they drop off. Heatmaps will show hotspots of clicks and scrolls, while event tracking logs button clicks and form submissions—perfect for marketers and developers.
Privacy is a priority too, with GDPR compliance and cookie-free tracking options to keep user data safe. The tech stack includes React.js for a smooth dashboard, Node.js for the backend, and PostgreSQL for secure data storage. For handling real-time data, Kafka and Elasticsearch step in to keep things running fast.
Future enhancements include adding AI-powered predictive analytics to forecast traffic trends, voice search tracking to monitor how users search, and a mobile app for checking stats on the go. Social media sentiment analysis is also on the roadmap, helping you track user feedback across platforms.
For website owners, bloggers, and e-commerce businesses, this system is a game-changer, offering insights to boost engagement and conversions. Let’s turn data into action and make your website work smarter.
Introduction
Purpose
The purpose of this project is to develop a Web Analytics System that allows website owners to monitor and analyze visitor behavior, including metrics like visitor count, traffic sources, session duration, most visited pages, and user engagement. This system will help businesses make data-driven decisions to improve website performance.
Scope
- Real-Time Visitor Tracking: Monitor active visitors on the website.
- Traffic Source Analysis: Identify where visitors come from (organic search, social media, direct, referral).
- Page & Link Analytics: Track most visited pages, bounce rate, and average session duration.
- Device & Browser Insights: Show data on user devices, browsers, and screen resolutions.
- Heatmaps & Click Tracking: Visual representation of user interactions.
- User Journey Mapping: Track user flow from entry to exit pages.
- Event & Goal Tracking: Monitor custom events like button clicks, form submissions, and purchases.
- Report Generation: Export data in PDF/CSV formats.
- Privacy-Focused Data Collection: GDPR-compliant tracking with anonymized data.
Target Audience
- Website Owners & Bloggers: To track visitor engagement.
- Marketing Teams: To analyze traffic sources and campaign effectiveness.
- E-commerce Businesses: To track conversion rates and customer behavior.
- Developers: To optimize website performance based on analytics.
Definitions, Acronyms, and Abbreviations
- Session – A period of user activity on a website.
- Bounce Rate – Percentage of visitors who leave after viewing only one page.
- CTR (Click-Through Rate) – The ratio of users who click a link compared to those who see it.
- Heatmap – A graphical representation of where users click or scroll on a page.
System Features
User Authentication & Dashboard
- User registration and login using OAuth (Google, Facebook, Email).
- Role-based access: Admin, Marketer, Developer.
- Website tracking setup with unique tracking ID.
Visitor Tracking
- Real-time analytics: Live visitor count and current active pages.
- Unique & Returning Visitors: Track new vs. returning users.
- Session Tracking: Monitor session duration and engagement time.
Traffic Source Analysis
- Referral Traffic: Identify websites sending traffic.
- Search Engine Traffic: Track visitors from Google, Bing, etc.
- Social Media Traffic: Analyze visits from Facebook, Twitter, LinkedIn, etc.
- Direct Traffic: Users entering the website URL directly.
- Campaign Tracking: UTM parameter tracking for marketing campaigns.
Page & Link Analytics
- Most Visited Pages: List of top-performing pages.
- Exit Pages: Identify pages where users drop off.
- Internal & External Links Clicked: Track outbound and internal link clicks.
- Scroll Tracking: Measure how far users scroll down a page.
Device & Browser Insights
- Detect device type (Mobile, Tablet, Desktop).
- Identify browsers (Chrome, Firefox, Safari, Edge).
- Screen resolution and operating system data.
Heatmaps & Click Tracking
- Mouse Click Heatmaps: Show areas where users click the most.
- Scroll Depth Heatmaps: Indicate how much of the page is viewed.
- Mouse Movement Tracking: Analyze cursor behavior for engagement insights.
User Journey & Funnel Analysis
- Track user flow from entry page to exit.
- Create funnels to analyze user drop-offs at different steps.
- Identify pages with high conversion or abandonment rates.
Event & Goal Tracking
- Track custom events (button clicks, downloads, form submissions).
- Set up conversion goals (e.g., successful purchases, sign-ups).
- A/B Testing Support: Compare user interactions across different versions of a page.
Reports & Data Export
- Generate daily, weekly, and monthly reports.
- Export data in PDF, CSV, JSON formats.
- Send automated reports via email.
Privacy & Compliance
- GDPR, CCPA Compliance: Anonymize user data if required.
- Cookie-Free Tracking Option: Allow tracking without cookies.
- Data Retention Control: Users can choose how long data is stored.
Technology Stack
Frontend
- React.js / Next.js / Vue.js – For the user dashboard.
- Chart.js / D3.js – For visual analytics & heatmaps.
Backend
- Node.js (Express.js) / Python (Django, Flask) – For API development.
- WebSockets (Socket.io) – For real-time visitor tracking.
- Redis – For caching frequently accessed analytics data.
Database & Storage
- PostgreSQL / MongoDB – For storing analytics data.
- Elasticsearch – For fast search queries.
Data Collection & Processing
- Kafka / RabbitMQ – For handling real-time analytics events.
- Google BigQuery / AWS Lambda – For scalable data processing.
Security & Hosting
- SSL/TLS Encryption – Secure data transfer.
- Role-Based Access Control (RBAC) – Restrict access based on user roles.
- Cloud Hosting: AWS, Google Cloud, DigitalOcean.
System Architecture
High-Level Overview
The system will use a tracking script (JavaScript) embedded on websites to collect data and send it to the backend. The backend processes this data in real time and stores it in a database for reporting and analysis. A dashboard UI will allow users to visualize and download insights.
Database Schema
- Users Table: Stores user authentication data.
- Websites Table: Stores registered websites for tracking.
- Sessions Table: Logs visitor sessions with timestamps.
- Events Table: Stores clicks, scrolls, and interactions.
- Page Views Table: Tracks pages viewed per session.
Implementation Guide
Development Setup
- Set up React.js / Vue.js for the frontend dashboard.
- Develop a Node.js / Python API for data processing.
- Configure MongoDB / PostgreSQL for data storage.
- Deploy Kafka / RabbitMQ for handling event streams.
Core Feature Development
- Tracking Script: JavaScript snippet to collect user data.
- Real-Time Analytics: WebSockets-based live visitor tracking.
- Page & Link Tracking: Monitor user navigation.
- Dashboard UI: Build interactive charts and reports.
- Report Generation: Enable PDF/CSV exports.
Testing & Optimization
- Unit testing for API endpoints.
- UI testing for analytics dashboard.
- Load testing to handle high-traffic websites.
Deployment
- Host the web app on AWS / DigitalOcean.
- Set up Cloudflare CDN for tracking script delivery.
- Use Kubernetes for scalability.
Future Enhancements
- AI-Powered Predictive Analytics: Forecast future traffic trends.
- Voice Search Tracking: Monitor how users search via voice assistants.
- Social Media Sentiment Analysis: Track user feedback from social platforms.
- Mobile App for Analytics: Allow users to check stats on the go.
Conclusion
This Web Analytics System is all about turning data into action. It’s designed to help you make smarter decisions, boost engagement, and drive conversions. With a focus on privacy and future enhancements on the way, this project is set to become a must-have tool.


